How to make MSG SEVIRI RGB with the tropy interface?
This tutorial shows how to make RGBs with MSG SEVIRI data on our TROPOS servers. It is possible to read data from hdf or HRIT (only low-res).
Import Libraries
[1]:
%matplotlib inline

import pylab as plt
import numpy as np
import datetime
from tropy.l15_msevi.msevi_rgb import MSeviRGB
[3]:
plt.rcParams['figure.figsize'] = (12.0, 8.0)
plt.rcParams['font.size'] = 18.0
plt.rcParams['lines.linewidth'] = 3
SEVIRI data are loaded into the MSeviRGB data container.
Configuration
For configuration, we have to set region, scan_type and time (as object).
[5]:
time = datetime.datetime( 2013, 6, 8, 12, 0)
region = 'eu'
scan_type = 'rss'
Initialize the Data Container.
[6]:
s = MSeviRGB(time = time, region = region, scan_type = scan_type)
Region suggests use of hdf file
/vols/fs1/store/senf/.conda/python27mod/lib/python2.7/site-packages/h5py/_hl/dataset.py:313: H5pyDeprecationWarning: dataset.value has been deprecated. Use dataset[()] instead.
  "Use dataset[()] instead.", H5pyDeprecationWarning)
Load RGBs
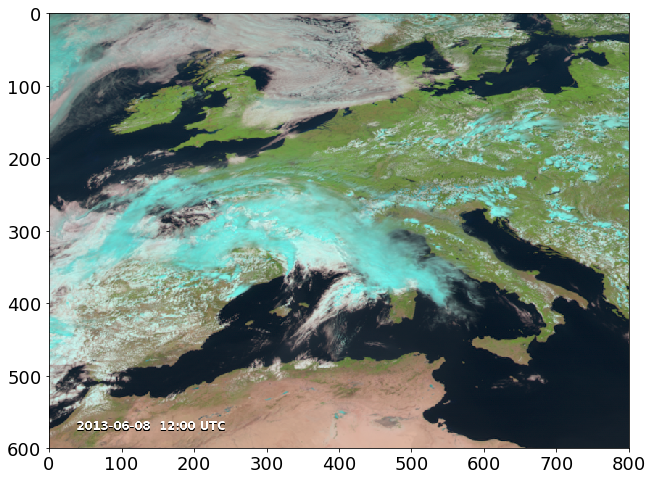
Start with the natural color RGB.
[7]:
s.create_rgb('pytroll_nc')
['IR_016', 'VIS008', 'VIS006'] is already loaded!
The images are stored in the s.images dictionary.
[8]:
print (s.images)
{'pytroll_nc': <PIL.Image.Image image mode=RGB size=800x600 at 0x7FF8F833A390>}
s.show is a method which opens an external viewer to see the image.
[9]:
#s.show('pytroll_nc')
This is how the image look like…
[11]:
rgb = np.array( s.images['pytroll_nc'] )
plt.imshow(rgb)
[11]:
<matplotlib.image.AxesImage at 0x7ff8db59b990>
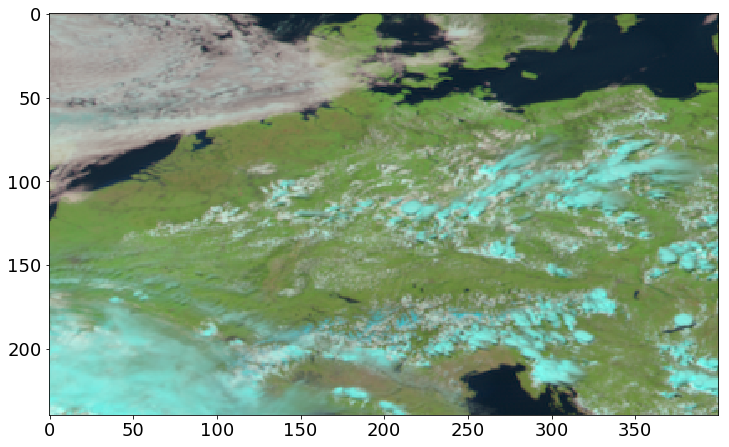
Adjusting Region Configuration
[12]:
region = ((216, 456), (1676, 2076))
s = MSeviRGB(time = time, region = region, scan_type = scan_type, tstamp = False)
Region suggests use of hdf file
[13]:
rgb = np.array( s.images['pytroll_nc'] )
plt.imshow(rgb)
[13]:
<matplotlib.image.AxesImage at 0x7ff8db46f810>
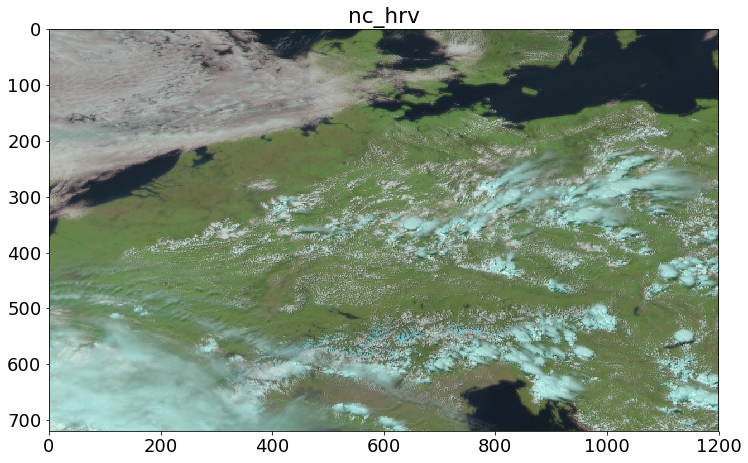
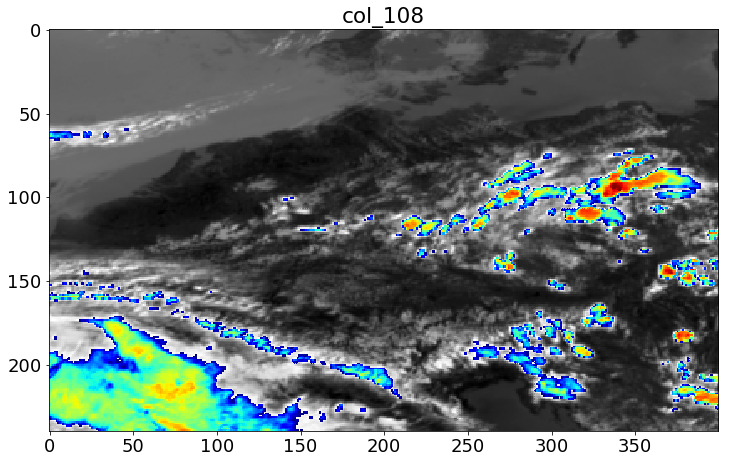
Loop over several RGBs
[16]:
rgb_list = ['pytroll_nc',  'nc_hrv', 'col_108', 'am', 'dust', 'severe_storms', 'hrv_clouds']

for rgbname in rgb_list:
    plt.figure()
    s.create_rgb(rgbname, tstamp=False)
    rgb = np.array( s.images[rgbname] )
    plt.imshow(rgb)
    plt.title(rgbname)
['IR_016', 'VIS008', 'VIS006'] is already loaded!
['IR_016', 'VIS008', 'VIS006', 'HRV'] is already loaded!
['IR_108'] is already loaded!
['WV_062', 'WV_073', 'IR_097', 'IR_108'] is already loaded!
['IR_087', 'IR_108', 'IR_120'] is already loaded!
['WV_062', 'WV_073', 'IR_039', 'IR_016', 'IR_108', 'VIS006'] is already loaded!
['IR_108', 'HRV'] is already loaded!


[ ]: